Visual Attention Audit: When a Slide Gives Your Eyes Too Many Places to Look
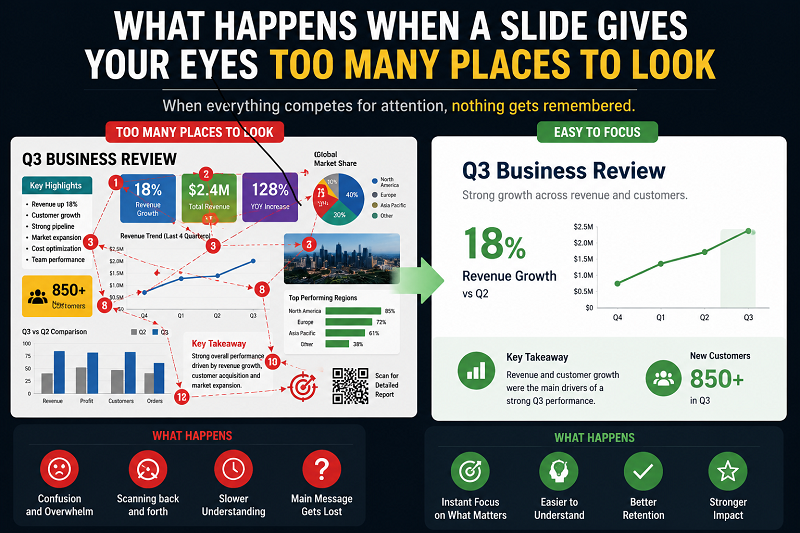
A presentation slide can contain nothing factually wrong and still be difficult to understand. The title is clear, the chart is accurate, the photograph is relevant, and every label technically belongs there, yet the audience spends several seconds trying to decide where to look first.
That hesitation matters because viewing a slide isn’t a passive act. The eyes move between objects, text, labels, numbers, icons, and the speaker, while the brain tries to work out which pieces belong together. When too many elements compete for attention at the same moment, some of that mental effort gets spent on navigating the slide rather than understanding the message.
The problem isn’t simply that the slide contains “too much information.” A slide can contain several pieces of information and still feel easy to follow when their relationship is obvious. Trouble begins when several elements appear equally deserving of attention and nothing tells the viewer which one should come first.
Your Eyes Start Searching Before You Start Understanding
Look at a clean slide with one sentence and one image, and the viewing path is fairly obvious. Look at another slide containing four charts, three colored boxes, a photograph, two large numbers, a logo, and six bold phrases, and the first task changes.
Before understanding anything, you have to search.
Which chart matters? Does the red box contain the main point, or is red just part of the template? Should you read the title first or inspect the number in the middle? Is the photograph evidence or decoration? Are the four charts meant to be compared?
That search consumes attention.
In this example, the viewer must inspect several areas before finding the intended comparison. A person unfamiliar with the subject may also need the relationships explained. These are practical design risks to check with a representative viewer, not a diagnosis of a learner’s attentional ability.
A presentation audience faces a similar problem when the slide doesn’t establish its own priority.
Visual Hierarchy Answers “Where Do I Look First?”
Visual hierarchy is the arrangement of elements so that some appear more prominent than others.
Size can create hierarchy. Position can create it. Contrast, spacing, typography, and color can do the same. What matters is that the viewer doesn’t experience every object as equally loud.
Consider a results slide containing one major finding and four supporting numbers. If all five numbers are the same size, same weight, and same color, the audience has to work out which one matters. If the central result receives visual priority and the supporting figures sit quietly around it, the reading order becomes much easier.
Hierarchy doesn’t mean making everything huge.
If the title is huge, the statistic is huge, three icons are brightly colored, and the chart has five saturated lines, nothing is truly dominant. The slide has several elements shouting at the same volume.
Good hierarchy creates differences.
Attention Splits When Related Information Is Separated
Some slides make viewers repeatedly move between two areas just to understand one idea.
A chart appears on the left. Its explanation appears in a text box on the far right. The audience reads the sentence, looks back at the chart to find the referenced line, returns to the text for the next statement, then searches the chart again.
The information may be accurate, but the viewer has to mentally connect pieces that the slide designer could have connected visually.
Research on spatial contiguity in multimedia learning supports integrating corresponding words and graphics. Applying that idea here means reducing unnecessary back-and-forth between an explanation and the feature it describes; it does not mean every element must be placed close together.
A simpler fix is often to move the explanation closer to the part it describes.
Instead of writing:
“Revenue from returning customers increased most strongly in Q3”
in a box several inches away, place a short annotation beside the Q3 data point.
Now the eyes don’t have to search for the relationship.
A Slide Can Make You Choose Between Reading and Listening
Another form of competition happens between the slide and the speaker.
Imagine a presenter explaining a new process while the screen shows a dense paragraph containing almost the same words. Many people begin reading the paragraph, which means they are now processing the speaker’s words and the slide’s words at nearly the same time.
The slide hasn’t become more informative. It has created two competing versions of the same message.
This is one reason presentation slides usually work better when they show the information that benefits from being seen while the speaker supplies the explanation that benefits from being heard.
A diagram can show relationships. A chart can show movement. A photograph can show something difficult to describe. A short phrase can establish the point.
A paragraph that simply reproduces the speech gives the audience another task.
More Relevant Images Can Still Become Too Much
Removing irrelevant decoration is an easy recommendation. The harder case is a slide where every image really is related to the topic.
Suppose a lecturer is explaining four symptoms and places four photographs beside the explanation. Each photograph has educational value. That doesn’t guarantee that displaying all four at once is the best choice.
Four relevant photographs still give the audience four possible inspection targets. If the current explanation concerns only one, test whether displaying the others helps comparison or merely invites looking ahead. The answer depends on the task and audience, not a fixed maximum number of images.
Relevance is therefore not the only test.
Ask whether every visual needs to be visible at this exact moment.
Sometimes the better sequence is one image, then another, then a comparison after the audience has understood each one separately. See how to choose and place presentation images for related examples.
Decorative Elements Compete Even When Nobody Reads Them
A decorative icon doesn’t need to contain text to attract attention.
Bright shapes, illustrations, heavy borders, large logos, background photographs, gradients, badges, and colored labels all contribute to the visual field. Individually they may look harmless. Together they can make it harder to see which elements belong to the actual argument.
This is why removing decoration sometimes improves a slide far more than shrinking the body text.
A presentation template can create the same problem when it demands a large logo, colored footer, slide number, patterned background, section label, and decorative shape on every slide. The content then has to compete with the template itself.
Branding can remain present without becoming one of the strongest visual objects in the room.
Color Loses Its Meaning When Everything Is Colored
Color is good at attracting attention because it creates contrast. Once everything receives a different bright color, that advantage disappears.
Imagine a chart with six colored lines, a red headline, three blue icons, a green callout box, and a purple footer. The viewer may notice plenty of color without knowing what any of it means.
Color becomes more useful when it has a job.
A muted chart with one emphasized series immediately tells the audience which line the speaker is discussing. A process diagram can use one accent to identify the current stage. A comparison can use one treatment for the baseline and another for the proposed state.
Consistency also helps. If orange means “risk” on one slide but simply decorates a heading on the next, the audience can’t build a stable interpretation of the visual language.
Motion Can Steal Attention From the Point You Are Making
Movement is difficult to ignore.
If an icon spins while you are explaining a chart, many eyes will move toward the icon whether or not it matters. An animated background, looping GIF, blinking indicator, or decorative transition can keep drawing attention after its informational purpose has ended.
Animation is more useful when it controls when information appears.
A complex process diagram, for instance, may be easier to explain when each stage appears as the speaker reaches it. The audience doesn’t have to inspect stages four and five while the presenter is still discussing stage one.
The same technique can help with charts, comparisons, and sequences, provided the animation itself remains restrained.
The goal is not to make the slide feel active. It is to control what deserves attention now.
Showing Everything at Once Creates Questions Too Early
A slide sometimes contains the complete argument before the speaker has reached it.
Imagine a five-step process shown in full while the presenter begins explaining step one. Audience members can already see step five, notice an unusual label in step three, or start reading the final outcome before the explanation has established how the process works.
Their attention gets ahead of the speaker.
This isn’t always harmful. Sometimes seeing the whole structure first gives useful orientation. The trouble comes when later information is visually strong enough to compete with the part currently being explained.
Progressive disclosure can solve that. Show the full structure faintly and emphasize one section at a time, or reveal later material only when it becomes relevant.
The audience still understands where the presentation is going without being asked to process everything simultaneously. For the trade-offs, see static slides versus progressive reveal.
Labels Work Better Near the Thing They Describe
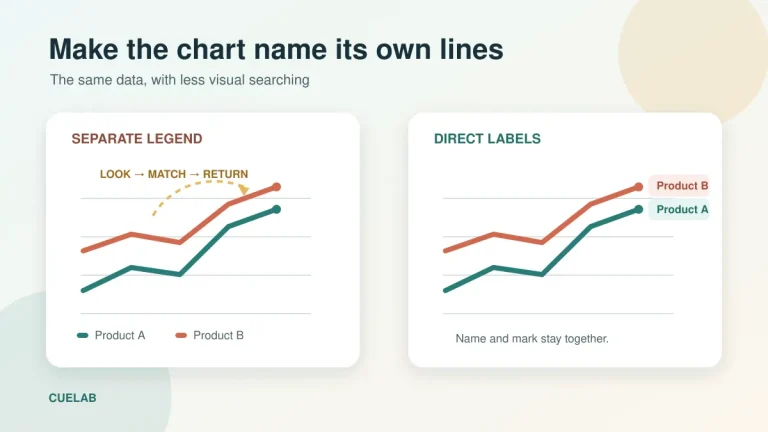
Legends are a familiar source of unnecessary eye movement.
A chart may contain four colored lines with a legend positioned underneath. To understand the blue line, viewers look at the line, move down to the legend, identify blue, return to the chart, and locate the line again.
Direct labeling can remove several of those movements.
Put the series name beside the corresponding line when the chart allows it. Place a short annotation beside an unusual data point. Connect a callout clearly to the region it explains.
This is a practical application of the spatial-contiguity principle discussed in the research chapter linked above. A direct label still needs enough room and contrast to remain legible; putting labels close to a line is not useful if they overlap other data.
Distance on a slide can create mental work.
The Speaker Is Also Competing for Visual Attention
The slide isn’t the only thing the audience can look at.
There is also the presenter.
During a story, explanation, question, or transition, the speaker may deserve most of the audience’s attention. A highly detailed slide can pull eyes away at exactly that moment.
This is not an argument for blank slides throughout a presentation. It means the visual intensity of the screen should match what the audience needs.
If you want people studying a chart, give them the chart and enough time to study it. If you want them listening closely to a personal story, consider whether a visually demanding dashboard should remain projected behind you.
Attention moves between speaker and screen. Slide design should help that movement rather than fight it.
“One Idea Per Slide” Is Useful, but Too Literal
The familiar rule that every slide should contain one idea is helpful until it becomes rigid.
A comparison naturally needs at least two things. A process may need several stages. A chart can contain many data points while still communicating one argument.
The stronger test is whether the slide has one clear visual purpose.
A comparison slide may contain six pieces of information, yet all six contribute to one question: how option A differs from option B. A crowded dashboard may contain twenty accurate metrics but fail because the audience doesn’t know what question it is supposed to answer.
Instead of counting objects, ask what you expect the viewer to notice or understand before the slide changes.
If you can’t answer that easily, the audience probably won’t be able to either.
Use Signaling to Tell the Eyes What Matters Now
One of the simplest ways to reduce visual competition is signaling.
Signaling means adding cues that direct attention toward relevant information or make the organization easier to see. The same multimedia-learning research chapter describes signaling as cues that highlight how essential information is organized. The useful feature is the cue’s relevance, not simply adding more arrows.
On a presentation slide, signaling can be very modest.
Bold the phrase that matters rather than the whole paragraph. Fade secondary lines in a chart. Use an arrow only where the relationship isn’t already obvious. Place a short heading above a group of related items. Change contrast when moving from one part of a diagram to another.
A cue works because other elements remain quieter.
If five arrows, four circles, and six highlighted phrases appear together, the cues themselves become clutter.
White Space Gives the Eye Information Too
Empty space isn’t wasted space.
Spacing tells viewers which elements belong together and which ones are separate. Two items positioned close together are more likely to be perceived as related, while a larger gap suggests a new group or section.
This can reduce the need for extra borders and boxes.
Instead of putting every group of information inside a colored rectangle, try grouping it through position and spacing first. The slide may need fewer visual objects while becoming easier to scan.
White space also gives dominant information room to stand apart. A central statement surrounded by space attracts attention without needing a giant font or bright shape behind it.
Sometimes the easiest way to create hierarchy is simply to stop filling every available area.
A Worked Redesign: One Message, Fewer Competing Signals
Consider an illustrative results slide about returning customers. The redesign below keeps the supporting information while clarifying its purpose. It is a design example, not a measured outcome.
| Slide choice | Crowded version | Clearer version |
|---|---|---|
| Title | Q3 results | Returning customers drove the Q3 increase |
| Chart | Every series has an equally bright color | The returning-customer series has one accent; comparison series stay visible but quieter |
| Labels | A detached legend below the chart | Readable series names beside the relevant lines |
| Explanation | A paragraph repeating the narration | A short annotation beside the change being discussed |
The viewer can now identify the claim, locate its evidence, and inspect the comparison. If the task instead requires comparing every series equally, use a balanced layout rather than emphasizing one result.
A Five-Second Test Can Reveal a Confused Slide
Open the slide without reading it carefully and look at it for about five seconds. This is a quick design heuristic, not a validated test of comprehension.
What attracted your eyes first?
What came second?
Could you tell what the slide was about?
If your attention jumped between several unrelated areas and you still weren’t sure what mattered, the slide probably needs stronger hierarchy.
Another useful check is to reduce the slide’s size until detailed text becomes unreadable. At thumbnail size, the large visual relationships become easier to see. You can quickly notice whether there is one dominant area or five equally strong blocks fighting for space.
Then return to normal size and decide what can be removed, grouped, faded, moved closer together, or revealed later.
If Your Eyes Don’t Know Where to Land, the Slide Isn’t Finished
The problem with a crowded slide isn’t that audiences dislike complexity. People can understand complicated charts, diagrams, systems, and arguments when the presentation gives them a route through the material.
Difficulty begins when the slide presents several destinations but provides no route.
Before showing a slide, decide what the audience should look at first and what they should notice next. Keep related words and visuals close, reduce competition from secondary material, and use contrast or timing to guide attention as the explanation develops.
A slide doesn’t need to contain less information simply to look minimal. It needs to make the order of attention easier to understand.
When the eyes know where to go, the audience has more mental room left for the idea you actually want them to remember.